Translated with DeepL.com (free version)
OSM mapping of building damage in Mayotte after cyclone Chido
On December 14, 2024, Mayotte was hit by Cyclone Chido, the most violent cyclone to hit the island in over 50 years. IGN quickly released Pleiades imagery taken on December 17, 18, 20, 21 and 24, and confirmed on December 25 that the OSM community could use it as a source for its editions. I immediately wanted to use them to assess damage to buildings. Why buildings? From a cartographic point of view, because damage is more visible on polygonal infrastructures than on punctual or linear ones. From a crisis-response point of view, because the damage was particularly extensive, having made the homes of many inhabitants disappear or impassable.
Three months on, this post takes a look back at the major stages of this ongoing mapping project, organized on a voluntary basis in my spare time.
Review and methodological choices
Mapping building damage using post-disaster imagery was obviously not invented in OpenStreetMap, and similar experiments have been carried out in the past in OSM.
After Cyclone Haiyan hit the Philippines in November 2013, building damage mapping had been carried out in the region around Tacloban. In March 2016, researchers at the Harvard Humanitarian Initiative (HHI) published an article detailing a methodology that was subsequently adapted to OSM in the form of preset models and a cartographic style for JOSM, and applied to Haiti after Cyclone Matthew in October 2016.
The Haiyan approach is limited to two labels for damaged buildings, using the building=* key directly, which is not ideal. The BAR approach had so far been adapted in OSM via two specific keys damage=* with the four categories of damage defined by HHI researchers (none, minimal, significant and complete) and damage:structure to qualify the type of construction according to three categories (light, medium, heavy). After tests carried out on Miréréni, using BD Ortho IGN and Pléiades imagery, and discussions with a geographer living in Mayotte, it became clear to me that while the damage classes were easy to determine, the construction type was difficult to determine directly, as the only element still visible was the roof. In addition, the intermediate “medium” type seemed difficult to classify.
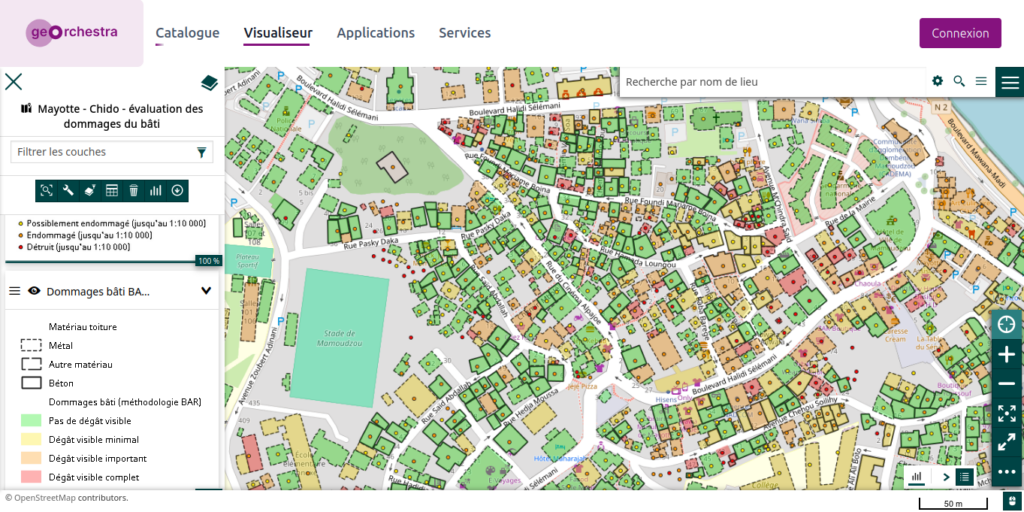
Consequently, rather than adding a label deducing a construction type from fragmentary elements, I preferred to map only the roofing material with the already existing and well-documented roof:material key. In the case of Mayotte, roofs are generally of two types, either a metal sheet roof of varying quality, whatever the size or use of the building, or a flat concrete slab which is in fact the floor of a future storey yet to be built.

During initial tests, the damage key was reused, but it has the disadvantage of quickly becoming obsolete, as soon as a building is repaired that is damaged rather than destroyed. And even if it’s not deleted despite its obsolescence, it will be difficult to know what event it refers to. That’s why I finally opted for a key damage:DisasterName=*, or damage:Chido=* in this case. The same logic of inserting the name of the disaster prevailed for the metadata tags to inform the name of the event, the source of the imagery used and its capture date.
This methodological review was also an opportunity to document the OSM wiki, with the creation of two pages: https://wiki.openstreetmap.org/wiki/BAR_methodology on the BAR methodology and its first OSM adaptation, which had not yet been documented, and https://wiki.openstreetmap.org/wiki/Building_damage_assessment for this new adaptation focused on the built environment.
Methodology testing and interactions with EMSR Copernicus data
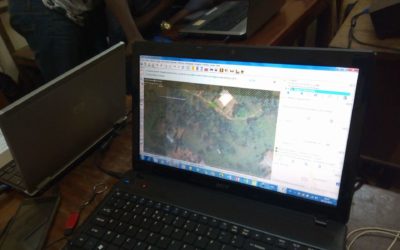
In the first days of January, Pleiades imagery was integrated into the imagery available from the JOSM imagery menu, and the first versions of the new preset model and its cartographic style for JOSM were produced and tested on a small area of Mamoudzou. The only unforeseen problem was the average quality of the building geometry, which sometimes needed to be rectified. On January 6, a project on the central area of Mamoudzou was created in the HOT Tasking Manager and opened only to intermediate or advanced OSM contributors, with detailed instructions accompanied by videos in English and then in French. During the few weeks of this test, the labeling is slightly revised (the integration of the disaster name in the keys, mentioned above) and the cartographic style is completely redone.

Discussions took place within the OSM France community (see this forum thread) and the methodology was validated by a representative of the CSTB for the purposes of rapid damage assessment. The choice of Mamoudzou also enabled us to compare the results of this community mapping inspired by the BAR methodology with the rapid assessment carried out between December 15 and 24 as part of the Copernicus program’s EMSR (Emergency Management Service Rapid mapping) 780, which focused on the central eastern face of the island of Grande-Terre and also on the island of Petite Terre.
The EMSR building damage data, available as open-licensed files (although not very clear), consist of vector points at the center of buildings, with three different classes: Possibly damaged, Damaged, Destroyed, which seem to correspond to the BAR methodology’s minimal, significant and complete categories. This means that there is no class for undamaged buildings, and in fact many buildings in the area under assessment have no points at their center. The limitation of this approach is that the proportion of damaged buildings in relation to the total number of buildings cannot be determined using Copernicus data alone. Furthermore, “possibly damaged” may also appear as an intermediate class between ‘none’ and “minimal” in the BAR methodology, so the two assessment scales may not overlap.
I’ve set up an automated cross-referencing of Copernicus point values with OSM buildings updated via diff minutes, and a measurement of the differences between the two assessments. This means that for each building evaluated by the two methodologies, we can see the class differences between the two evaluations. It turns out that a difference of one class is more frequent than an identical class.
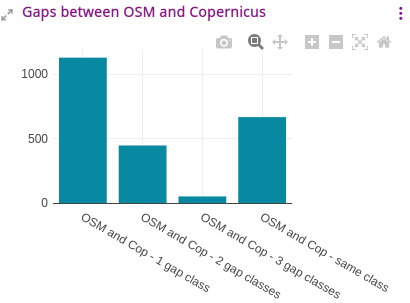
An analysis has yet to be carried out to explain these differences. However, this comparison was limited to this test area, as I felt it was more important to map areas not covered by EMSR780.
Application to other areas, making data available and community outreach
To make the most of the areas covered by Pleiades imagery, I digitized the first four areas not obscured by clouds (the one for 12/24 was practically unusable). The approach was then to create one project at a time in the HOT Tasking Manager, each centered on a single locality, so as not to discourage contributors when faced with multiple projects or a large project with hundreds of tasks. The first localities to be evaluated are commune chief towns on both sides of the northern part of Grande-Terre: Tsingoni, Bandraboua, M’Tsamboro, Acoua and M’Tsangamouji.
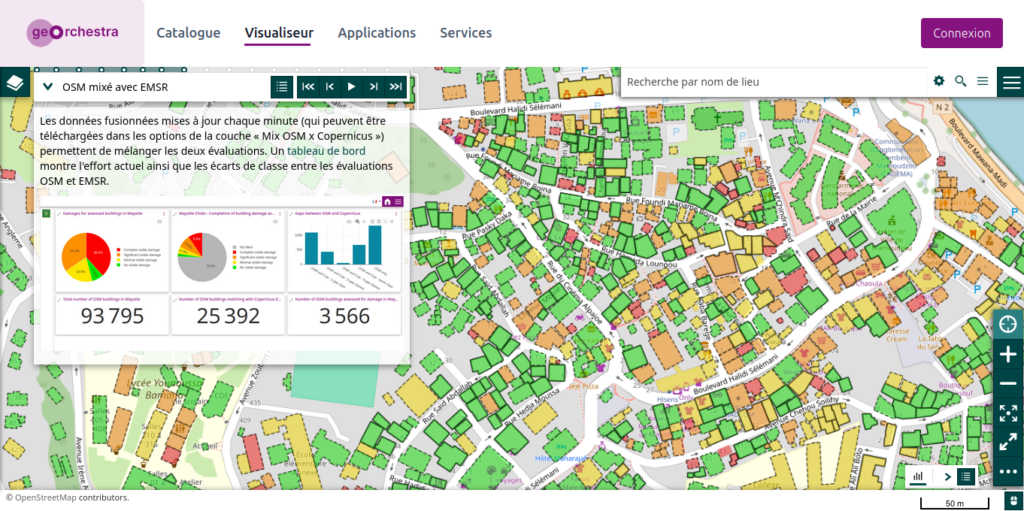
As no OSM rendering shows these damage classes, I’ve created several styles for the building layer resulting from the cross-referencing of OSM and Copernicus EMSR780 data, shared on MapStore contexts (one in French, the other in English), with a presentation of the approach via MapStore’s own cartographic contexts. Data can of course be downloaded from the interface.
Despite my personal experience of setting up projects in the Task Manager since almost the very beginning of the tool, community animation has sometimes proved surprising: classic exchanges or technical questions via the platform’s commenting tools, but also a not inconsiderable proportion of contributors, at least of intermediate level (having therefore already created at least 150 OSM modification groups) who only modify building geometry, without characterizing damage or roofing material, despite the most detailed text and video instructions I’ve been able to produce so far. This is undoubtedly due to the habitual use of Task Manager projects, the vast majority of which are devoted to creating or modifying building footprints. In an attempt to remedy this, I’ve started organizing video workshops (in English, French or Portuguese) to demonstrate how to map this damage, in all-mouse mode or using keyboard shortcuts to speed things up.
As well as continuing to coordinate this remote mapping effort on Mayotte, other activities are still to come:
- a comparison of this remote mapping with damage assessment data collected in the field. This is already partly feasible with post-disaster imagery hosted in Mapillary, and tends to confirm the choices made with Pleiades imagery, but the interest would lie above all in comparing with assessment data carried out by building damage assessment specialists
- the replicability of this exercise, both in terms of documentation to enable others to take up this methodology in other contexts, and in the crucial access to post-disaster imagery.