Strengthening the Methodological Approach
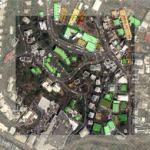
In my previous post about mapping building damage in Mayotte, I announced my intention to compare damage assessed in OpenStreetMap (OSM) using post-disaster Pleiades imagery with other datasets. I also plan to promote replicating the mapping exercise by presenting the approach and its results.
From this perspective, I realized that it would be useful to have more detailed statistics than those shown in the produced dashboard so far by integrating a new indicator, methodological rapprochement, and another territorial scale. In the IFL PostgreSQL database dedicated to Mayotte, I decided to:
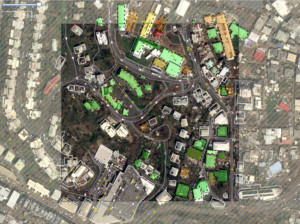
- Calculate the fraction of assessable buildings on post-disaster Pleiades imagery. This includes buildings visible on at least one image and excludes those masked by cloud cover.
- Consider OSM buildings in Copernicus assessment zones not intersected by an EMR780 point as undamaged to enable a direct class-to-class comparison with the BAR methodology adapted to OpenStreetMap. This is not always the case when EMSR780 points are so off-center that they do not intersect their corresponding OSM building, but such cases are rare.
- Disaggregate the indicators to the level of Mayotte’s 17 communes to visualize the heterogeneity of the damage across the territory.
New indicators
The layer that cross-references OpenStreetMap (OSM) buildings with the EMSR780 assessment is updated every minute. It now indicates “NR” instead of “NULL” for buildings without an associated EMSR780 point. An hourly extraction of Mayotte commune boundaries from the OSM database, cross-referenced with buildings, contains sums by commune of all damage assessment indicators and roofing material types, as well as new indicators:
- The imagery used,
- The total number of buildings in the commune (total_buildings),
- The number of buildings assessable on post-disaster imagery (building_imagery_operable_yes_count),
- The number of assessed buildings (damage_osm_emsr_all_count),
- The number of assessable buildings that have not yet been assessed (damage_osm_emsr_not_done_count),
- The ratio of the last two indicators gives the current percentage of completeness (building_damage_assessed).
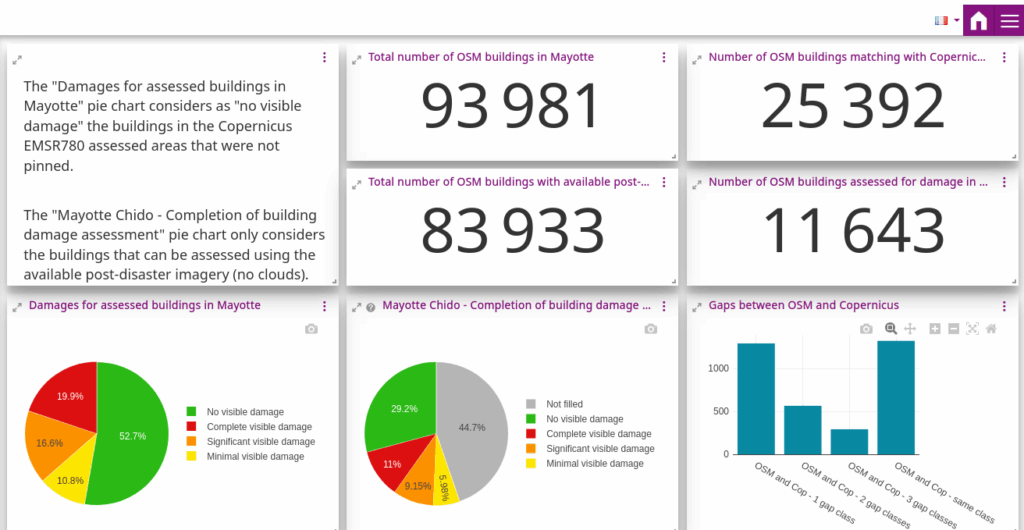
These new indicators enabled me to modify the dashboard, which now shows the total number of buildings assessable with post-disaster imagery. The two pie charts use a modified calculation that takes into account EMR780 “NRs” and potentially assessable buildings, as explained in the box at the top left.
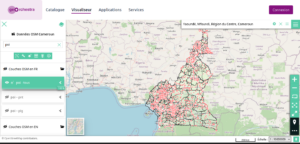
The communes layer was used to create multivariate pie charts that are updated hourly. This representation is visible in the last map view of this MapStore context, as well as in the new, specific MapStore context on Chido.
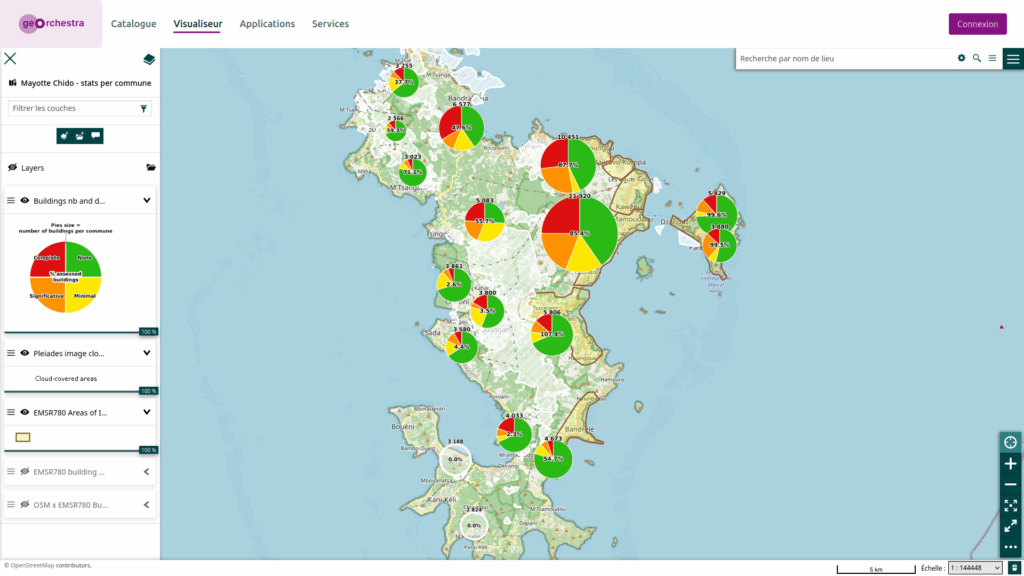
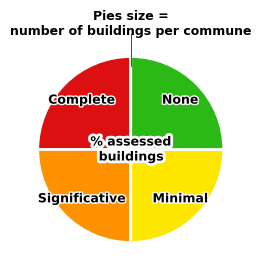
As shown in the legend:
- The size of the pie charts represents the total number of buildings in the commune, and the exact number is displayed at the top.
- The colors represent the proportion of damage classes among assessed buildings.
- The percentages in the center represent the ratio of assessed buildings (using EMSR780 or OpenStreetMap) to the total number of assessable buildings in Pleiades’s post-disaster imagery.
As a reminder, the four damage classes of the BAR methodology provide information on visible damage, not actual damage, to be specified in the field by specialists. A building with no apparent damage in post-disaster Pleiades imagery may not be intact. For instance, buildings with concrete roofs (that actually will become the floors of future upper levels) often appear undamaged. However, after speaking with architects in Mayotte, I learned that this type of construction is likely to have cracks from the cyclone. These cracks lead to water infiltration, which will weaken the building over time. This illustrates the importance of mapping roofing types in addition to BAR damage classes.
All of the layers are available for download from this metadata sheet or from the various MapStore map contexts.
Results showing the spatial heterogeneity of building damage after Chido
These pie charts are rich in information.
- Over 85% of communes covered by EMSR780 zones have been mapped. Dembéni exceeded 100%, suggesting that EMSR780 had access to cloudier imagery than that supplied by CNES/Airbus.
- Of the EMSR780 communes, only the two largest show a profile in which visibly damaged or destroyed buildings represent the majority. In the southernmost EMSR780 communes, the proportion of damaged or destroyed buildings is only 20%-30%.
- However, two communes outside of EMSR780, Bandraboua and, more notably, Tsingoni, show profiles where damage and destruction exceed 50% and approach 75%, respectively. These communes would have been more deserving of an EMSR assessment than those to the southeast.
- The northern part of Mayotte, where assessment percentages are high, shows considerable heterogeneity in damage, ranging from 25% to around 75%. The island of Petite Terre and the northwestern side of Grande Terre appear to have been more spared.
- The communes in the southwest are still too poorly assessed to reach a conclusion, but they do not appear to have suffered less damage.
These results demonstrate the value of this mapping project carried out in OSM, which provides a more comprehensive and nuanced view of the open data available through Copernicus EMSR. This updated pie chart representation will also serve as a tracking map for an upcoming “Project of the Month” within the OSM France community.
Translated with DeepL.com (free version)